Go-To Financial Metric Primer: EBIT, EBITDA, and EBITA Definitions and NetSuite Report Tutorial

Financial metrics help measure your company's performance so you can make better decisions. Therefore, you need a way to generate fast, reliable financial reports.


We understand how important quick, transparent reporting is to your company. You must be able to measure and report on its profitably accurately, or you can’t satisfy investors and make wise decisions. You need an easy process for collecting and organizing data, particularly for EBIT, EBITA, and EBITDA metrics.


Our guide covers the meaning of EBITA, EBITDA, and EBIT, how to use them, and how to create reports for them in NetSuite.


SuiteDynamics partners with NetSuite to customize and implement NetSuite Enterprise Resource Planning (ERP) systems and other products. Our company also employs financial experts who can help build the most efficient and effective custom reports possible, so your business has the data it needs to compete.  


Schedule a free consultation and start collecting and organizing data that helps your business own the marketplace.


Schedule a FREE Consultation
Graphic explaining the EBITA meaning.


What Does EBITA Mean?


EBITA stands for Earnings Before Interest, Taxes, and Amortization. It's a financial metric used to evaluate a company's operating performance without the effects of monetary and accounting decisions and tax environments. Here's a breakdown of its components.


Earnings: Profit a company generates from its operations.


Before: Earnings calculated before deducting the specified expenses.


Interest: Costs incurred from borrowing money. Expenses are excluded in the EBITA calculation to assess the company's operational profitability regardless of its financing structure.


Taxes: Vary significantly depending on the company's location and legal structure. Excluding taxes allows for a better comparison of operational efficiency across different entities and jurisdictions.


Amortization: Gradual write-off of the intangible assets' value over time.


Investors and analysts use EBITA when focusing on a company's core operational profitability. According to the Corporate Finance Institute (CFI), net income indicates a company’s overall profitability, but EBITA reflects general proceeds.


“The true performance of a company’s operations can be determined when the effects associated with taxes, interest, and amortization are removed,” CFI explains. “Since the effect of such items is excluded in EBITA, investors consider it an important measure to determine a company’s true earnings.”


Why It's Used


EBITA is useful for analyzing companies with significant intangible assets. By excluding amortization, EBITA can offer a clearer view of the operating performance of such businesses.


However, some prefer EBITDA as a more comprehensive operational performance view because it excludes depreciation.


SuiteDynamics financial experts can help customize financial processes and reporting software that helps collect and organize data in ways that benefit your company most. Tell us what you need and watch your efficiency skyrocket.


Schedule a FREE Consultation
Graphic explaining the meaning of EBITDA.


What Does EBITDA Mean?


EBITDA stands for Earnings Before Interest, Taxes, Depreciation, and Amortization. It measures a company's operating performance by calculating its earnings before subtracting interest expenses, taxes, depreciation, and amortization.

The concept, of course, is very similar to EBITA but adds “depreciation” to the list of exclusions.


Depreciation is the systematic allocation of a tangible asset’s cost over its useful life. It represents the decreased value of physical assets (like machinery, buildings, and vehicles) used in a business over time.


Removing the impact of non-cash expenses (depreciation and amortization), as well as interest and taxes, helps EBITDA provide a clearer view of operational profitability and cash flow potential. It can more easily compare the performance of companies across different industries or with varying capital structures.


“[EBITDA] can give an analyst a quick estimate of the value of the company, as well as a valuation range, by multiplying it by a valuation multiple obtained from equity research reports, publicly traded peers, and industry transactions, or M&A,” CFI explains.


Investors and analysts often use EBITDA as a proxy for a company's cash flow from operations. Yet, EBITDA doesn’t account for capital expenditures or changes in working capital, which help you understand the actual cash flow available to fund operations, debt obligations, and investments.


Why It's Used


EBITDA eliminates the effects of non-operational factors to offer a cleaner profitability comparison between companies and industries. It's beneficial in sectors with significant investments in physical and intangible assets.


Schedule a free consultation with SuiteDynamics to discuss all your reporting needs. Our financial experts can ensure your company has the right processes for easy and accurate data collection that equips it to succeed.


Schedule a FREE Consultation
Graphic explaining the meaning of EBIT.


What Does EBIT Mean?


Sometimes, companies opt for the simpler EBIT or Earnings Before Interest and Taxes. This metric calculates a company's operating income by excluding only interest expenses and taxes from its net income. EBIT provides insight into the profitability of a company's core operations without considering the impact of its financial structure (debt vs. equity financing) and tax obligations.


EBIT is particularly useful for analysts and investors who want to understand a company's ability to generate profits from its core business activities. EBIT is like operating income, though operating income can have minor differences in how companies calculate it based on their accounting practices. For instance, they may change how they classify operating vs. non-operating items.


Why It's Used


EBIT offers a straightforward view of a company's operating performance by removing the effects of its financing structure and tax obligations. Since it includes depreciation and amortization, it reflects the costs associated with tangible and intangible assets. It also offers a more conservative measure of operational profitability.


SuiteDynamics experts can design reporting solutions that provide your company with any financial metrics it needs to succeed. Schedule a free consultation and see how easy reporting can become.


Key Differences


Usefulness


Each metric serves a different purpose based on the appropriate factors for the business under evaluation. EBITDA compares companies across industries by normalizing differences in financing and capital expenditures. EBITA is particularly relevant for companies with significant intangible assets. EBIT, being the most conservative, is useful for assessing operational performance, including the cost of tangible and intangible assets.


Industry Application


The preference for one metric over another can vary by industry, depending on the nature of the capital investments (tangible vs. intangible assets) and how they impact operational performance analysis.


Important Note:


Neither EBIT, EBITA, or EBITDA are financial metrics approved by the Generally Accepted Accounting Principles (GAAP). Consequently, you must also use other measures if your company complies with those standards.


Creating EBIT, EBITA, and EBITDA Reports in NetSuite


NetSuite doesn’t come with EBIT, EBITA, or EBITDA reports out of the box. Fortunately, you can build one quickly in a few steps.


The process remains generally the same for all report types. Simply adjust the financial section list based on the kind of report you need (Step #6).


  1. Open the native NetSuite Income Statement.
  2. Click Customize.
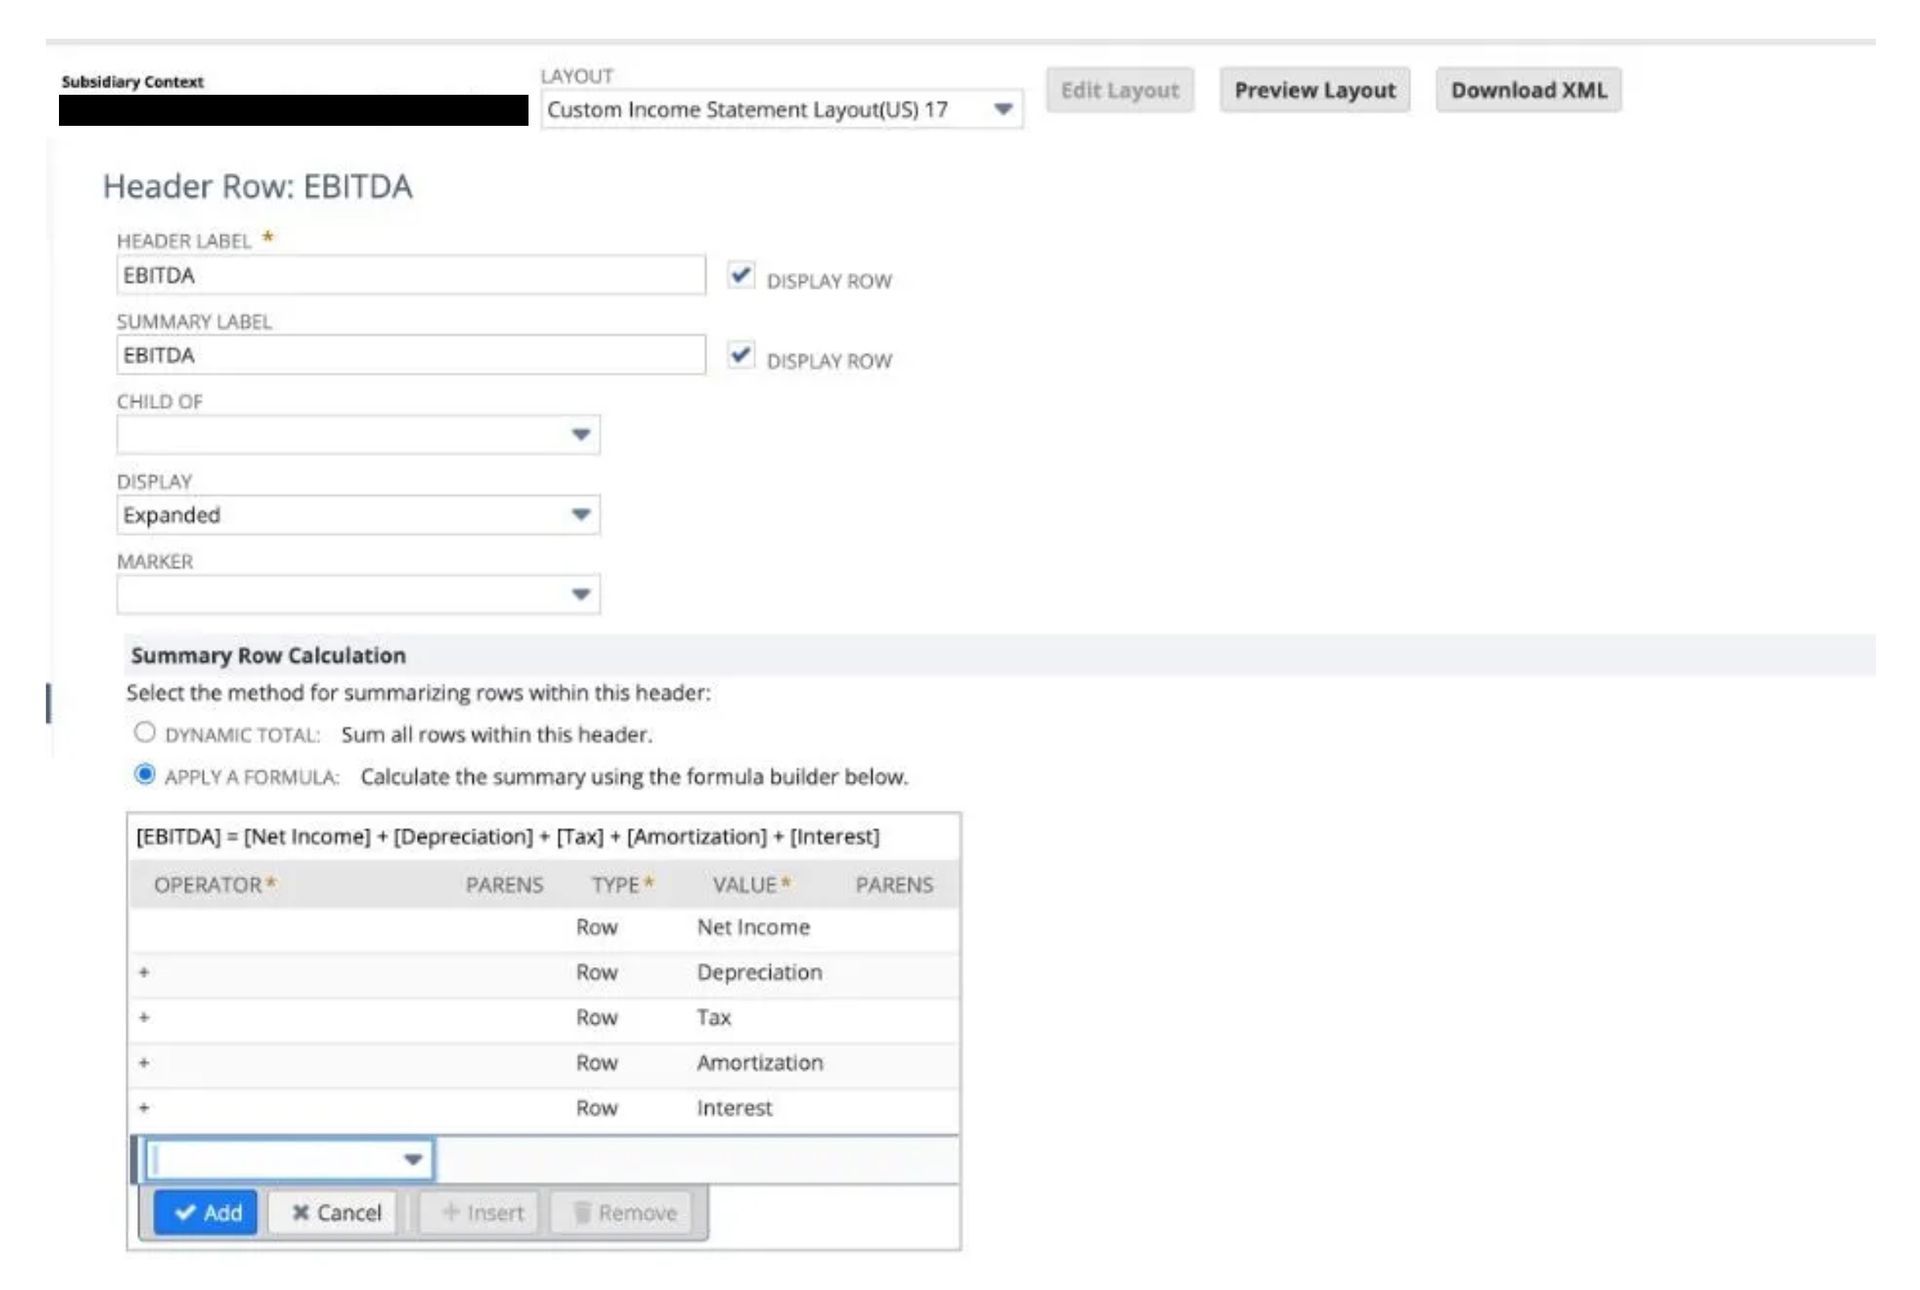
  3. Click Add Header and Summary Rows.
  4. Title the Header and Summary labels either “EBITDA,” “EBITA,” or “EBIT”—whichever report you want to create.


First screenshot showing how to create an EBITA report.


      5.  Click Add Financial Section.

 a.  Create a New Section.


   6.  Create one financial section for each type of account you add back. (Of course, c and d are optional.)

 a.  Interest

 b.  Tax

 c.  Deprecation

 d.  Amortization

    7.  Enter the section name in the Header label and click the Display row.


The third screenshot showing how to create an EBITA report in NetSuite.


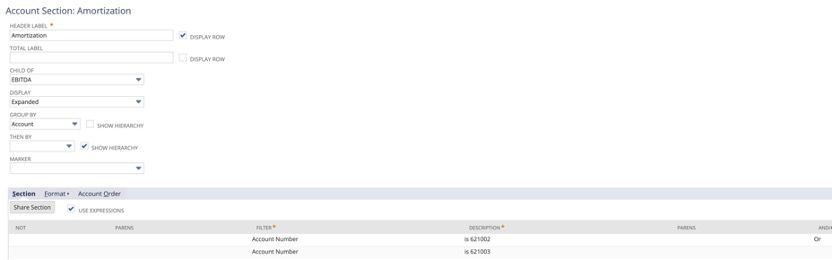
    8.  Select your Header from the Child Of dropdown.

    9.  Uncheck Show Hierarchy for Group by Account.

   10.  Check the Use Expression box under the section header.

   11.  Use the Or function to add every account number you want to include in this section.

   12.  Under the Format Section, check the Reverse Sign box.

 a.  Natively, NetSuite brings the expense accounts over as a negative. This process will reverse that action.

   13.  After all sections have been created, go back to the EBITA, EBITDA, or EBIT summary.


The fourth screenshot showing how to create an EBITA report in NetSuite.


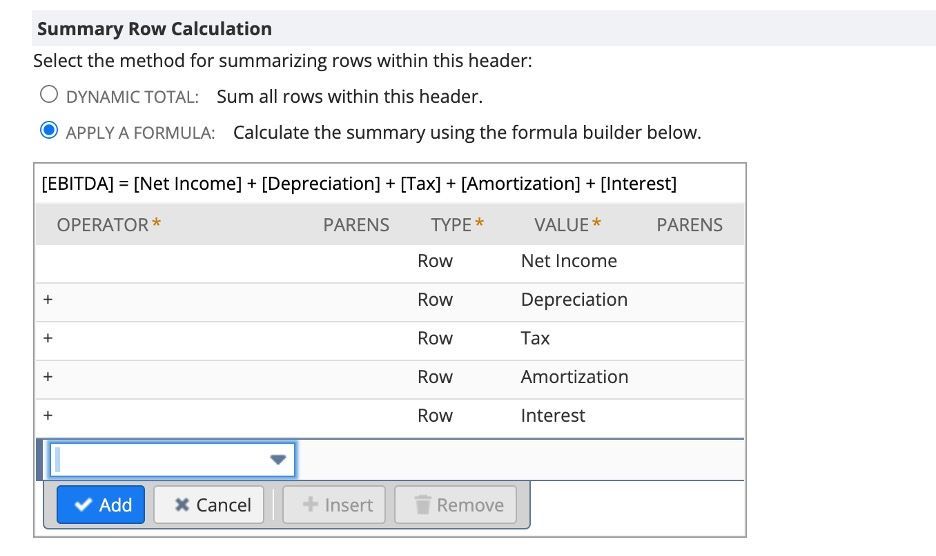
   14.  Click Apply a Formula Radio.

   15.  Select Type “Row” and Value Net Income.

   16.  Use the “+” operator to add each financial section to the formula.

   17.  Save your report with the desired name.

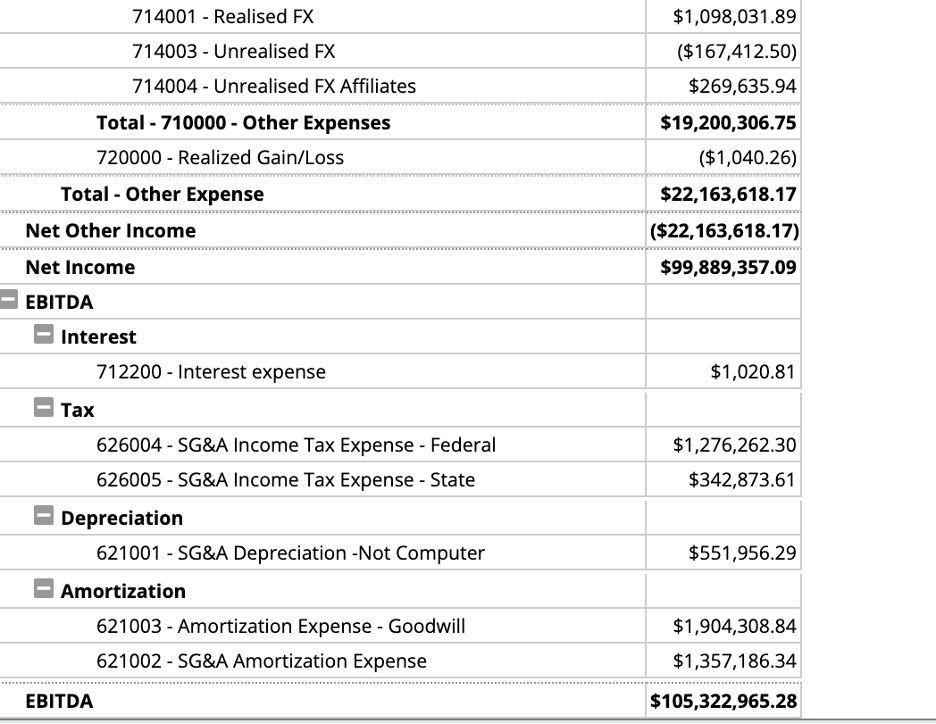
   18.  Your income statement will then feature an additional EBITA, EBITDA, or EBIT section.


The fifth screenshot showing how to create an EBIT report.


If you have other reporting needs, schedule a consultation with SuiteDynamics. You’ll get quality customization built by people who understand both software and finance. 


Schedule a FREE Consultation


Get Custom Reports That Actually Work


Some NetSuite reports are difficult to customize unless you have experience with the system. You can easily waste time building one that doesn’t work well and causes more problems than it solves.


We know you don’t have the spare time or staff to invest in terrible reporting. SuiteDynamics employs NetSuite and financial experts to create effective custom reports that organize data into easily accessible and digestible documents.


Tell us about your reporting needs, and we’ll ensure you get the software necessary to meet them and satisfy stakeholders.


Schedule a FREE Consultation


We pull information from NetSuite material, SuiteDynamics experts, and other reliable sources to compose our blog posts and educational pieces. We ensure they are as accurate as possible at the time of writing. However, software evolves quickly, and although we work to maintain these posts, some details may fall out of date. Contact SuiteDynamics experts for the latest information on NetSuite ERP systems.


Part of this text was generated using GPT-3, OpenAI’s large-scale language-generation model. After generating the draft language, our team edited, revised, and fact-checked it to ensure readability and accuracy. SuiteDynamics is ultimately responsible for the content of this blog post.


March 27, 2026
Spreadsheets built modern business. For decades they served as the unofficial operating system of job shops and custom manufacturers everywhere. They are flexible, familiar, and just comfortable enough to feel like a real solution. In the early days of a growing shop, they genuinely work. But as make-to-order complexity increases, as custom BOMs multiply, lead times tighten, and engineering revisions pile up, spreadsheets strain under the pressure. Every job is different, but spreadsheets want everything to be the same. In make-to-order environments, no two jobs are identical. Unique BOMs, custom routings, variable material costs, different setup requirements, customer-specific specs. Spreadsheets, though, thrive on repetition and standardized rows. So the more variation you introduce, the more tabs you create. The more exceptions you add, the more manual overrides appear. The more formulas you patch together, the more fragile the whole thing becomes. Eventually, the file turns into something only one person truly understands. That’s a liability, not a system. Capacity becomes a guessing game. In make-to-order shops, capacity isn’t theoretical. It’s constrained by reality. Machines go down. Operators vary in skill. Setup time fluctuates from job to job. Rush orders blow up carefully planned weeks. Spreadsheets struggle here because they’re built on static inputs. You can build a beautiful planning sheet with machine-hour allocations, but unless it dynamically adjusts for real-time job status, operator availability, overlapping resource conflicts, and maintenance downtime, you’re not really planning. You’re forecasting best-case scenarios. And that’s exactly how shops overpromise delivery dates and end up paying for it later in overtime and expediting costs. Engineering changes don’t cascade cleanly. Change is a constant in make-to-order manufacturing. A customer tweaks a dimension, a material substitution becomes necessary, or a tolerance tightens halfway through production. In an integrated system, that change automatically updates BOMs, routings, cost projections, and scheduling impact all at once. In a spreadsheet environment, it depends entirely on who remembers to update which tab. A routing might change without adjusting the labor estimate. A material substitution might never feed into the margin calculation. A lead-time adjustment might not reach the production schedule until it’s too late. These small disconnects multiply quickly, and because spreadsheets have no enforced relationships between data sets, the errors don’t announce themselves. Institutional knowledge becomes a single point of failure. Ask most growing job shops who owns the master spreadsheet and you’ll get a name. One estimator, planner, or operations manager who has become the living interpreter of years’ worth of embedded formulas, assumptions, and logic that nobody else fully understands. This works fine until it doesn’t. When that person goes on vacation, gets sick, or leaves, the shop loses operational clarity. In an environment already defined by complexity, having critical knowledge live inside one person’s mental model of a file is an inefficient bottleneck. Visibility stops at the file boundary. Spreadsheets are static snapshots. Make-to-order manufacturing is anything but. Without real-time feedback loops, shops find themselves unable to answer questions that should be simple: Are we actually on track this week? Which jobs are consuming more labor than quoted? Where is the bottleneck right now? Which customers consistently drive margin compression? When performance data doesn’t flow automatically from the floor back into quoting and planning, improvement stalls. You can’t refine what you can’t see. Here’s the thing about spreadsheet failure in manufacturing… it’s not dramatic. It’s gradual. First the files get slow, then fragile, then opaque. By the time leadership feels the real pain through late shipments, squeezed margins, and rising overtime, the architectural issues are widespread. Make-to-order manufacturing demands systems that understand relationships: how a routing affects capacity, how a BOM revision affects cost, how a delayed job cascades through the rest of the schedule. The question most shops ask is whether they can make the spreadsheets work. The better question is what it’s actually costing to keep them. The most resilient make-to-order manufacturers are building systems that preserve flexibility without sacrificing the visibility needed to actually run the business. Adaptability is the advantage. 
March 23, 2026
In custom manufacturing , when systems break down, profit rarely disappears all at once. It leaks. Quietly, repeatedly, and often in ways that never show up clearly on any report. Walk into almost any fabrication shop and you’ll hear some version of the same story: the backlog is strong, revenue looks good, we’re staying busy. And yet the margin feels thinner than it should. For job shops running custom work, profitability doesn’t usually collapse because of one bad decision. It erodes through small, daily inefficiencies buried inside quoting, scheduling, engineering changes, and the gap between what was planned and what actually happened on the floor. Here’s where shops most commonly lose efficiency, and how to get it back. The quote that was almost right. For custom orders, every quote is a prediction, and predictions are dangerous when they’re disconnected from real shop-floor data. Outdated labor standards, underestimated setup time, material prices that changed since the template was built, and capacity assumptions based on average weeks instead of current reality. These errors are each small on their own, but a 4% underestimate on labor here, a missed secondary operation there, add up across hundreds of jobs. Small errors compound into real margin loss. The best-performing shops treat quoting as a living system fed by actual job performance data, not static spreadsheets that nobody updates. Capacity that looks available but isn’t. On paper, there’s open space on the schedule. In practice, that open week includes a machine down for maintenance, a senior operator on vacation, two complex jobs already competing for the same bottleneck, and a rush order someone verbally committed to last Thursday. Without finite capacity planning, shops routinely overcommit based on theoretical machine hours rather than real-world constraints. The fallout is predictable: overtime spikes, expedited shipping costs, re-sequencing chaos, and exhausted operators. Margin shrinks not because the shop is incapable, but because it’s planning in averages. Engineering changes that never get repriced. Designs evolve. A hole moves, a weld spec changes, or a tolerance tightens. Each adjustment has a cost. But many shops hesitate to reprice midstream, worried about damaging the customer relationship, and end up absorbing the extra labor and rework time instead. Do this enough times and it becomes a cultural norm: “we’ll just take care of it.” That’s margin erosion disguised as good service. High-performing job shops track engineering change impact in real time and make repricing decisions based on data rather than discomfort. Setup time hiding in plain sight. In low-volume, high-mix environments, setup time is often the silent killer. When shops don’t track setup separately from run time, assume it’ll all come out in the wash, and never refine their routings based on what actually happened, they end up underpricing complexity. In job shops producing one to fifty unit runs, setup can represent a disproportionate share of total labor. If it isn’t measured accurately, it can’t be priced accurately. The spreadsheet layer nobody talks about. Most shops run a hybrid environment where the ERP handles transactions and spreadsheets handle reality. Capacity lives in one file, quoting assumptions in another, and actual job performance in someone’s head. This creates invisible disconnects. Quotes not aligned with current routing, schedules that don’t reflect real constraints, and historical performance that never feeds forward into better decisions. Each disconnect feels manageable in isolation. Collectively, they create margin leakage that leadership can feel but can’t quite locate. What makes all of this so frustrating isn’t that shop owners don’t care. It’s that they can’t see clearly enough to act decisively. Without integrated visibility across quoting, routing, capacity, and quality, operators run on instinct. And instinct works remarkably well until scale and complexity outpace it. The shops that consistently outperform aren’t necessarily the biggest or the busiest. They operate with clarity and consistency. Fewer assumptions and more decisions based on reality. In a manufacturing landscape where lead times keep shrinking and customers expect speed and precision at the same time, margin won’t be protected by effort alone.
Factory worker in hard hat using laptop, monitoring control panel with screens.
January 5, 2026
Every manufacturing leader has lived this moment: The schedule looks perfect. Orders are slotted. Commitments are made. And then reality shows up. A machine goes down. A key operator calls out. Setup times balloon. One late job cascades into five. Suddenly the plan (built meticulously inside your ERP) falls apart. Not because your team failed, but because the plan was never grounded in reality to begin with.  The Hidden Lie Inside Most ERP Schedules
Woman Working in Modern Factory Setting
August 27, 2025
NetSuite’s Model Context Protocol (MCP), built in partnership with Anthropic, helps users leverage AI
job shop manufacturing
June 20, 2025
Job shop manufacturing is a production method where small batches of 1-100 units of customized or unique products are made to meet specific customer requirements. Unlike mass production, each order typically requires unique setups, specialized processes, and custom routing through the facility. In this comprehensive guide, you'll learn: The complete definition of job shop manufacturing How job shops differ from other manufacturing types Industries that rely on job shop methods Technology solutions that optimize job shop operations When to consider implementing specialized ERP systems What is Job Shop Manufacturing? (Definition) Job shop manufacturing is a production strategy focused on customization over volume . Instead of producing thousands of identical items, job shops create small quantities of unique products tailored to specific customer specifications. Key defining characteristics: Small batch sizes - Typically 1-100 units per order High product variety - Hundreds or thousands of different products Custom specifications - Each order has unique requirements Project-based workflow - Work orders last days to weeks Skilled labor - Requires specialized expertise and flexibility Job Shop is a powerful, fully integrated solution built for custom manufacturers, combining quoting, configuration, production, and fabrication workflows inside NetSuite. Learn more about SuiteDynamics' NetSuite Job Shop for Manufacturing.
A man is holding a box and a woman is looking at a tablet in a warehouse.
By Grace Martin May 27, 2025
Uncover the challenges of data quality affecting DIO accuracy, from ghost inventory to inconsistent formats. Find out how to tackle these issues effectively with a NetSuite ERP.
May 8, 2025
In the world of private equity, creating operational value has become increasingly critical as the market evolves. With exit timelines extending and competition for deals intensifying, PE firms are looking beyond financial engineering to drive returns. One emerging strategy that's gaining traction is the consolidation of NetSuite instances across portfolio companies. The Hidden Challenge of System Fragmentation As PE portfolios grow through acquisition, a common pattern emerges: multiple portfolio companies operating on separate NetSuite instances. While each system may work effectively in isolation, the fragmentation creates significant operational inefficiencies at the portfolio level: Redundant Licensing Costs: Each separate instance requires its own licensing structure , creating unnecessary expenses that directly impact EBITDA. Manual Consolidation Effort: Finance teams spend countless hours extracting, transforming, and manually consolidating data from disparate systems. Inconsistent Processes: Basic business functions are handled differently across portfolio companies, limiting standardization efforts. Limited Portfolio-Wide Visibility: Gaining insight across the entire portfolio requires extensive manual effort, delaying strategic decision-making. Integration Challenges: Onboarding new acquisitions becomes increasingly complex when each company maintains its own environment.
Esusu logo
April 30, 2025
Explore Esusu's partnership with SuiteDynamics to enhance financial processes. Schedule a consultation to see how your business can thrive with NetSuite solutions.
Image of an office worker and a laptop, illustrating the concept of case management setup.
By Brittany Klecker April 30, 2025
Discover how to effectively set up and configure case statuses, rules, types, priorities, and more in NetSuite's case management system. Streamline your workflow and improve customer support with this comprehensive guide.
A man is holding a stack of cardboard boxes in a warehouse.
By Grace Martin April 26, 2025
Backorders disrupt revenue and frustrate customers. Learn what "backordered" means, how backorders happen, their impact on businesses, and how NetSuite ERP can minimize the issues.
More Posts